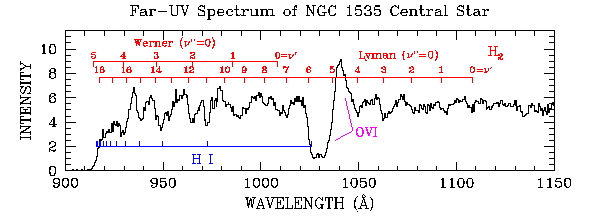

The above graph shows the intensity of far-ultraviolet light (vertical axis) as a function of wavelength (horizontal axis) for the central star of a planetary nebula known as NGC 1535. This "spectrum" tells us that the star is very hot, and yet is surrounded by cooler atomic and molecular hydrogen gas, which causes many of the features in the graph. The prominent "O VI" P Cygni profile arises from a huge stellar wind that emanates from the star. (This spectrum was obtained with the Hopkins Ultraviolet Telescope during the Astro-1 Space Shuttle mission in 1990.)